The cloud is great. Stop the hype. – This is an excellent article on what cloud computing is and isn’t and when the use of the cloud is the correct technical or architectural choice. I had a long post planned on the overloaded term “cloud computing” but OmniTI covers all the important points in this article. Like any new approach to infrastructure deployment that promises quick provisioning of services, people often forget that all of that infrastructure needs to be managed. There are a lot of good tools coming out to help with that management but none make it zero cost.
Dissecting Today’s Internet Traffic Spikes – With the above article on cloud computing and this article on the sudden nature of internet traffic spikes, I’m becoming an OmniTI fanboy. Part of my job is to worry about designing and provisioning correctly for sudden changes in traffic patterns, and Theo is correct that you have to design for spikes, not react to spikes.
Kanban For Sysadmins – I’ve started doing Kanban at work for one of our Operations teams and have been really pleased with the results so far — so much so that we’re rolling it out for another team this week and hopefully the rest of the department over the next few weeks. We track our work in Request Tracker, but it is hard to know 1. what is being worked on right now, and 2. how much throughput a team has. Kanban lets us know both, and it also lets us avoid the entire topic of prioritization of future work. We only prioritize when we are ready to start doing new work. I’ll post a follow-up to this once we’re further along in our Kanban experiment.
Hello From A libc-free World! – Have you ever wondered what, exactly, your “Hello, world!” program does? Jessica at Ksplice dives into what happens when you build a super-simple C program (it’s more complicated than you think!).
Data-Intensive Text Processing With MapReduce – A freely available draft in PDF of an upcoming book on using MapReduce to process large text datasets. One of the cool things we’ve done at ITA is add tracking data to each and every request that passes throughout our reservation system, and we output this tracking information in each log entry in every component we’ve written. The structure of this tracking data is such that if you aggregate the logs from all of the components you can easily construct a graph of the request’s path through the reservation system (including the asynchronous calls). The problem now is searching all of that log data, and I’ve been curious about MapReduce as it applies to this sort of data mining.
A while back I was working at a company during and after the purchase of a competitor. The competitor also made database-backed web sites, but ran them on Oracle, while our company was an MS SQL Server shop. This was my first experience administering Oracle, and the Operations team wasn’t given much time to learn the ins and outs of running an Oracle server. Furthermore, we were told that the competitor’s software would be migrated off Oracle in a month or two, so there wasn’t any money to spend on Oracle training.
Our backup provider had an MS SQL Server plug-in that did over-the-wire replication as well as the usual full backups and transaction log backups. We could restore our MS SQL Server instances to almost any point in time if needed. This provider didn’t have an Oracle plug-in, so instead we used Oracle’s exp/imp utility to make full exports which we then used the backup provider’s OS tools to backup. We knew about RMAN (Oracle’s backup utility), but we only used it for cleaning up archive logs. We tested restores regularly, and in general had very good backup practices.
http://www.flickr.com/photos/scoobay/3163954667/
One of the competitor’s customers, who was now our customer, started calling the help desk complaining about failures in the software. The errors were all over the place, seemingly random events that could crop up at any time. Worse, the customer couldn’t get to some of its data. The developers and some of the Operations team got together to investigate the errors while other Operations people started pulling backups and restoring to staging servers; the restores appeared to import without problems but we’d still see errors and couldn’t find all of the data.
After much consternation we figured out that the event that ended up sneaking past our backup protection was block corruption on one of the table datafiles in Oracle. We resolved this with the assistance of expensive conversations with Oracle, who showed us how to recreate the lost data and how to setup RMAN to do backups as well as our exports. It turns out that RMAN allows you to restore individual blocks in the event that a corrupt block is detected, and RMAN itself can find corrupt blocks when backups are taken. Oracle also offers a command line tool, dbv, which will verify datafiles from the command line.
The incident analysis of this event was very educational but also frustrating. The frustration was because we felt that no matter the changes we made to our backups, no matter the monitoring implemented, no matter how much we learned about Oracle, we could easily miss one of the many complex failure modes in this complex system.
Another common frustration in Operations is that we only have so much time and money to spend on failure mitigation. And, even if we had unlimited resources to monitor everything, we may still miss the important events because of the poor signal to noise ratio that comes with over-monitoring.
How do we choose what to worry about?
One of my favorite ways to figure out what is important to spend operations time and money is to do a Failure Mode and Effect Analysis (FMEA). FMEA is a technique I learned about while studying six sigma while working at PowerSteering Software. The purpose of FMEA is to understand failure modes and their risks. FMEA is a great tool for Software Operations because it will allow the Operations team to understand where best to assign limited resources for topics such as monitoring, high availability, performance, backup, and disaster recovery.
FMEA assigns severity, detectability, and frequency values (from 1 to 10) to each possible failure mode of a specific system function. For severity, a value of 1 means no impact, while a 10 means total system meltdown, for detectability a value of 1 means that the event is always detectable while a 10 means the event is never detectable, and for frequency, a value of 1 means that the event never happens while a 10 means the event occurs continuously. The product of those three values is a Risk Priority Number (RPN), which is used as a sorting key. Failure modes with a higher RPN have more serious impact than modes with a lower RPN. In other words, you should be working to mitigate failure modes with high RPNs.
The initial list of failure modes is brainstormed by the all of the groups involved in the software, and then the same groups assign the scores for severity, detectability, and frequency.
Here’s an example FMEA for a hypothetical database storage subsystem. There would typically be a key that goes along with an FMEA that explains what each severity, detectability and frequency value means so the user can understand the assigned ratings, but for the sake of space I’ve not included a key in the example below.
Regular cable examination, clean up cable runs in hosting center, subscribe to vendor notification of storage firmware issues
High read/write latency
degraded user experience, failed transactions due to timeouts
4
Storage block contention, too few spindles to sustain read/write rates, disk cache too small
6
latency monitors, OS tools, vendor storage network tools
3
72
Change RAID level to better distribute load on the storage array, spread datafiles across LUNs, use table partitioning
Disk Full
Writes fail, possible database unavailable
7
Sudden growth in writes, admin error
3
Nagios alerts, OEM alerts
1
21
Switch from filesystem-based datafile storage to ASM to avoid user access to datafiles, QOS write rates
Storage Unavailable
Database unavailable
10
SAN switch down, cable unplugged
2
OEM alerts, various Nagios alerts, user notification
1
20
Fully redundant SAN fabric
An example of an FMEA for database storage failures.
This is an example that is illustrative of what may be discovered when you create an FMEA. In the table above we can see that latency and data corruption are important areas of concerns because they occur often (the high latency case) or because they are very difficult to detect and are very severe (the corruption case). These two top-risk items warrant an investment in failure mitigation and detection.
That’s not say the items with the highest RPN are the only things you should spend time on. The FMEA doesn’t capture the economics of mitigation nor do they always reflect the true cost of loss of service. In the above example, “disk full” may appear to the customer as the same failure as “storage unavailable”. Also, there may be close to zero cost for mitigating disk space issues (monitors for disk space are available in all monitoring packages), but a significant amount of cost in mitigating latency problems (you may have to re-architect the application). FMEA should be used alongside common sense and experience when choosing risk mitigation strategies.
On MicroSD Problems – The investigation of a failing batch of MicroSD cards leads to an amazing story of detective work that delves in to the world of semiconductor manufacturing, gray markets, and failure rates.
CloudClimate CDN Speed Test – A clever use of XMLHTTPRequest to time HTTP downloads of small files (64KB) to your machine from the leading CDNs and cloud providers. I’m a sucker for the pretty graphs the tool creates with the data, but beyond that I can see how this tool is useful for people evaluating CDN/cloud choices by geographic location.
Drizzle – “An Open Source Microkernel DBMS for High Performance Scale-Out Applications” are all words I know and put together in that order sound interesting. Has anyone played with this yet?
NCSA Mosaic – Now you can run Mosaic on your hexacore i7 box; the fastest AJAX is the kind that doesn’t even happen!
The Panic Status Board – I recently learned the term “information radiator” and this is a perfect example of the concept. A simple, striking visualization for what is most important to Panic for the operation of their business. It’s a network operations center for your entire business. It’s hard to see how a single board would work for a large organization, but I’d love to build one for the group I’m in at work.
DevOps, SecOps, DBAOps, NetOps – A discussion of the problem of silos inside operations organizations, and how it is important to focus on the relationships between those groups as well as relationships with people outside of Ops. As I see it, all of the *Ops initiatives are attempts to fix the brokenness in communication that traditional software shop organizational charts create; managers and up need to realize the cost in agility that comes with creating silos. On the other hand, there is a clear benefit to specialization and building service groups around specific disciplines once a company gets to a certain size. I don’t have a good solution to this problem but spend a lot of time thinking about it… however, I do know it pays to meet the people you are working with face to face, have a beer and understand what drives those groups to make the decisions they do. I sometimes wonder if doing “embedded engineering” is the right approach, with engineers from all of the silos sitting together for the duration of a cross-functional project. If anyone has any thoughts on this I’d love to hear them.
Until a few weeks ago I ran the performance and capacity testing team for the airline reservation system ITA develops. The group is under the umbrella of operations, which may seem out of place to many software shops, where typically the performance testing team exists in QA (or doesn’t exist at all until needed). We work very closely with development and QA as needed (and often, development has a dedicate set of engineers on performance work), and after doing performance work for the past few years, I’m convinced the best people for the job are the people that are skilled in development and systems administration (these are the DevOps people everyone is talking about). We’ve developed a lot of processes and tools to do our job and I think other people might find these ideas as useful as we have.
Testing Tools
At ITA we had to build many of the performance tools we use in-house because performance tools that could speak the airline industry protocols used by many interfaces to a reservations system (MATIP, for example) don’t exist. We also have a set of custom XML interfaces as well as a large collection of other interfaces that we need to send traffic to, or read instrumentation from. Our initial load generation script not only generated this traffic but also took care of all the other functions required to run an experiment, but this monolithic script didn’t scale. We ended up breaking up that script into agents that can be distributed across many machines, with each agent performing a single function needed for a load test. The agents are run by a master scheduling script which co-ordinates agent start and stop. In this way we can be sure that instrumentation requests aren’t blocking the load generation tools from working, and we can also schedule periodic events, report status, and do the hundred other things required for a full-system load test.
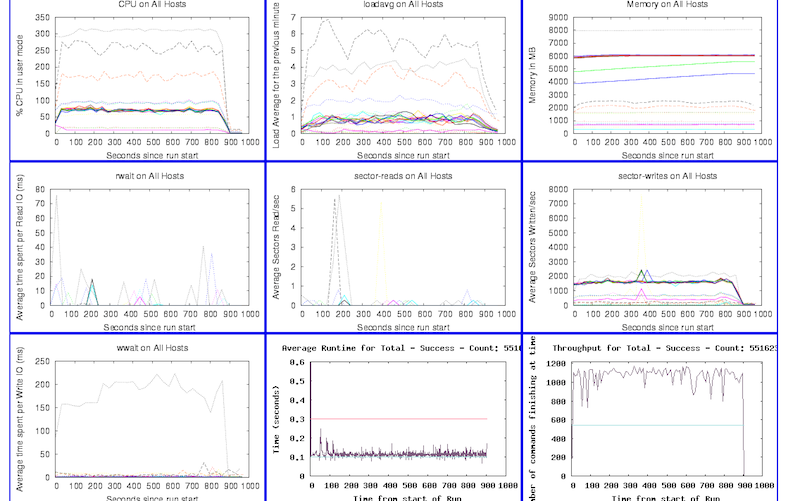
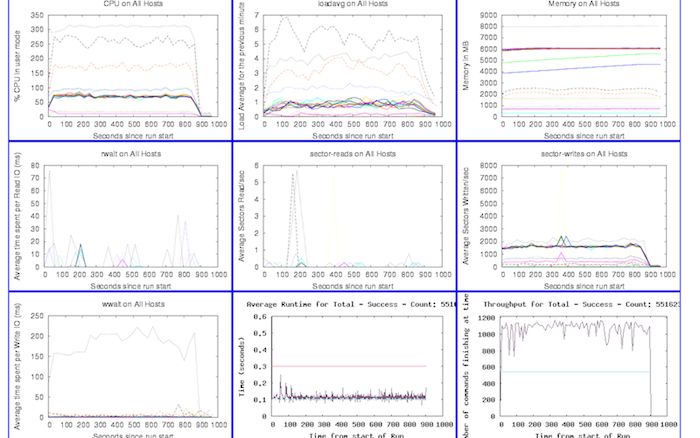
We gather a lot of metrics during a test, and for every major performance test we automatically generate a dashboard to help us drill into the results, a subset of which looks like this:
We gather this data from the system via SNMP, munin, per-component instrumentation, and other monitoring tools. We’ve been very happy with munin in particular as you can quickly add support for gathering new data types from remote hosts by writing simple Perl scripts.
Continuous Automated Testing
In any large system I’ve worked on the hardest problems are the integration problems, and a complex multi-component system such as a reservation system has these in spades. When we started doing performance testing, most of the system components weren’t finished and the interfaces between components kept changing. Furthermore, airline schedules, inventory and availability change rapidly over time.
There are countless factors that play into the performance and scalability of a complex system, and there are many philosophies around testing such systems, but in this post I want to discuss the technique that saves us the most time and money: continuous automated performance testing.
As discussed in the groundbreaking article Continuous Integration & Deployment In The Airline Industry[note: article not groundbreaking], ITA uses Hudson to build and test a complete reservation system on each check-in to the source tree (provided a build is not in progress). Hudson deploys the built software to a cluster of machines that are dedicated to continuous performance testing. After deployment, the load test master control software I discussed earlier runs a fixed scenario of load against the newly-deployed software. After a run completes, we store all of the results and instrumentation data in a database and update the graphs which trend test results over time. If our scripts find too much deviation in run time or throughput between this run and the previous runs, we set a status code so that Hudson can tell the people who’ve checked in since the last run that they may have broken the build.
Having a visual representation of performance issues in the continuous test environment has helped us tremendously because it both shortens the debug time and lets us see patterns of performance over time. Here’s an example of our throughput graph for a single component when someone breaks the build (click on the image for a larger version):
Along the X axis are revision numbers, and on our system the graph will show you the commit messages and the usernames of everyone who committed for each revision when you mouse over the data points. We also make the graph very user-friendly with a “green lines are good, red lines are bad” design. Clicking on a data point will bring you to our internal source code repository browser.
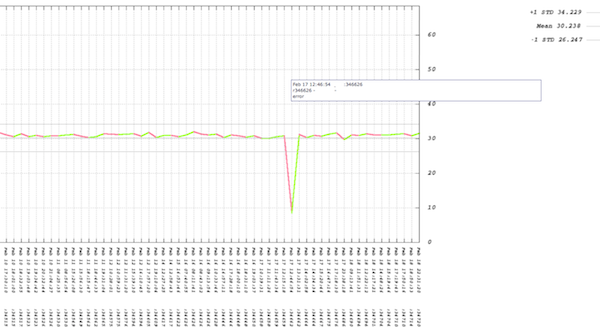
Throughput, which is shown in the above graph, is only one side of the story. What about the run time of the system during the issue with revision 346626?
The multiple trend lines in this graph represent the timings reported by each instrumentation layer in this component. In the case above the graph is saying that the issue is not with CPU time consumed by the component (that trend is flat), but is instead with time spent in the database. This helps us quickly narrow down where to start looking for the cause of the performance problem. In this example, the developer fixed the issue quickly because the developer had notification of the failed test within an hour of check-in and had all the tools and data needed to isolate and resolve the problem.
At ITA we have environments we use to run large-scale performance tests, but the setup, execution and analysis for such tests are very expensive in terms of computers (many hundreds) and people (tens for what may be a few weeks for a single test). Those resources aren’t cheap, and the wins from automating performance testing finding a single bug save us more then the cost of the computers and people we invested in building this system — and we routinely see 2-3 performance regressions in a month.
It doesn’t take many computing resources to build a system like the one I’ve described. Here are some tips for doing this yourself:
Use real machines, as virtual machines suffer from the other guests on the same machine
Define a fixed workload you can replay via your load generation tool as this lets you establish a baseline to trend and alert from
Make sure your workload represents the majority of the types of load you’d see in production
Start simple and add metrics and instrumentation as you need them, not before
Don’t worry about fancy presentation of the results – it is more important that you start getting results
Publicize your testing system widely once it is up and running to help spread a philosophy of continuous testing in your organization
If you’ve got any questions I’d be happy to answer them in the comments and would love to hear about any systems like this that other people have built.
How MySpace Tested Their Live Site With 1 Million Concurrent Users – Until recently at ITA I ran the reservation performance testing group in operations and can appreciate how hard it is to do good performance testing, and the scale of this experiment is awesome. The article is light on details but the comment by Todd Hoff makes this worth a read.
A Few Billion Lines Of Code Later – Excellent article about the evolution of Coverity‘s static code analysis tool from a research project to a real product. I think this article does an good job of illustrating that what your customer wants and needs and is almost never what you expect. Everyone who has been in startup will identify with the problems Coverity faced (and is probably still facing).
Jim Bird had interesting things to say about continuous deployment in a recent blog post on his site, Building Real Software. Jim concluded a blog entry that is otherwise full of useful insights with these dismissive paragraphs:
It’s bad enough to build insecure software out of ignorance. But by following continuous deployment, you are consciously choosing to push out software before it is ready, before you have done even the minimum to make sure it is safe. You are putting business agility and cost savings ahead of protecting the integrity or privacy of customer data.
Continuous deployment sounds cool. In a world where safety and reliability and privacy and security aren’t important, it would be fun to try. But like a lot of other developers, I live in the real world. And I need to build real software.
I commented on Jim’s blog that I work on building airline reservation systems at ITA Software and we try to do as much continuous deployment and continuous integration as possible. We are absolutely far from perfect in what we do, but accepting that is the first step to accepting the evolutionary model of software operations.
I think the use of continuous integration/deployment (CI/CD) is orthogonal to issues around privacy, security and safety; if you don’t care about privacy, security and safety then you’re writing bad software, whether you choose to do CI/CD or not.
The reservation system ITA has built is a large, mission critical, multi-component, distributed, high-throughput transactional system. We run our software on Linux on commodity hardware, and the components are written in a variety of languages (Python, Java, C/C++, PL/SQL and LISP). Each component has to be highly available. The software needs to be secure; we process credits cards, flight information and sensitive passenger information. We don’t implement the systems that measure fuel or balance the plane, but as with any part of the airline industry, safety is very important.
So how could we possibly continuously deploy or integrate this software? We deploy an entire reservation system to our development environment at least three times a week. We run an automated set of integration tests against this complex system to verify a deployment. We build and package each component of the software automatically on every check-in to our source tree and automatically run a set of tests against this software. We build controls around privacy, security and safety throughout this system.
We trigger our build/package/deploy cycle using Hudson and custom scripts. The build process is unique per component but generally follows industry standard practices per language or technology, and the packaging is done with RPM. The interesting part, and the part that makes CI and CD work for us, is that we’ve built software and processes to represent the reservation system as a whole. We package manifests that represent, in Python’s Coil, the dependency matrix of the components and services that make up a working reservation system. The coil in the manifest file details all of the software RPMs, component configurations, service validation scripts to be run, monitoring configurations and more. Manifests themselves are revision controlled, and each manifest has an ID that is all that is needed to start a deployment. If we chose to, we could have a manifest built and deployed on every check in to our source tree (this isn’t feasible due to human and computer resource limitations, but is technically possible). Manifests can be promoted throughout the other environments as needed, so we can move from the automatically deployed and tested environments to customer facing or testing environments that may need to be static for long periods of time.
Our deployment framework can automatically control the state of our monitoring. The framework will suppress monitoring during deploys, check monitor states any time during a deployment, and enable monitoring at the end of the deployment. The framework also ties in to our ticketing system by automatically opening a ticket for every deploy and documenting deploy state in the ticket. If a deployment fails, we can track the resolution directly in the ticket that the tools opened for the deploy. The deployment framework automatically resolves the ticket it opened after a successful deploy.
We also use service command and control software that we’ve built in house (similar to ControlTier) to make sure the services are in the correct state. We wrote our own service management framework because at the time we started this project there wasn’t existing software that met our particular needs; now there are many excellent solutions. Our deployment framework, which is driven by the manifest described above, has the ability to work with our service management framework so we can verify the state of our components as part of our deployment.
One of the differences between our CI/CD process and the process at Flickr or Facebook is that our customers, both internal and external, want predictable change and often dictate our release cycles. Perhaps this is what Jim means by CI/CD putting customers at risk, because some customers don’t want continuous updates to their software. Despite this, we still do CI/CD internally at ITA because failing a customer deploy can mean an airplane doesn’t fly. I’m not interested in learning how to deploy a reservation system the day of a production deployment with those kinds of stakes.
The big advantage of automating our deployments as much as possible and doing as many deploys as possible is the same in the airline industry as it is at any company: we deploy a lot so we know our deploys work. Continuous deployment is nothing more than another step in assuring that you are minimizing errors throughout your service. Not doing CI/CD is like not doing QA.
I’ve got more stories about the successes (and many, many struggles) of CI/CD at ITA and they’ve been kind enough to give me permission to post some of the stories here (we do some really cool things in performance testing that I’m excited to write about), so please check back often for more post about CI/CD at ITA.


