Performance Testing An Airline Reservation System
Until a few weeks ago I ran the performance and capacity testing team for the airline reservation system ITA develops. The group is under the umbrella of operations, which may seem out of place to many software shops, where typically the performance testing team exists in QA (or doesn’t exist at all until needed). We work very closely with development and QA as needed (and often, development has a dedicate set of engineers on performance work), and after doing performance work for the past few years, I’m convinced the best people for the job are the people that are skilled in development and systems administration (these are the DevOps people everyone is talking about). We’ve developed a lot of processes and tools to do our job and I think other people might find these ideas as useful as we have.
Testing Tools
At ITA we had to build many of the performance tools we use in-house because performance tools that could speak the airline industry protocols used by many interfaces to a reservations system (MATIP, for example) don’t exist. We also have a set of custom XML interfaces as well as a large collection of other interfaces that we need to send traffic to, or read instrumentation from. Our initial load generation script not only generated this traffic but also took care of all the other functions required to run an experiment, but this monolithic script didn’t scale. We ended up breaking up that script into agents that can be distributed across many machines, with each agent performing a single function needed for a load test. The agents are run by a master scheduling script which co-ordinates agent start and stop. In this way we can be sure that instrumentation requests aren’t blocking the load generation tools from working, and we can also schedule periodic events, report status, and do the hundred other things required for a full-system load test.
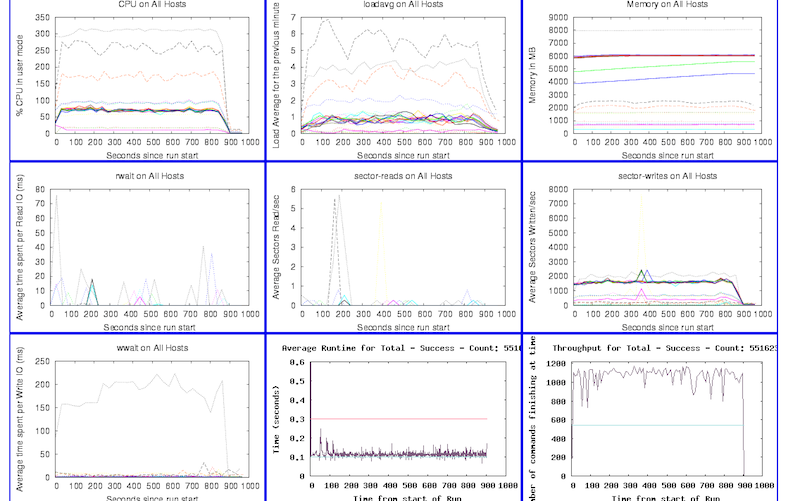
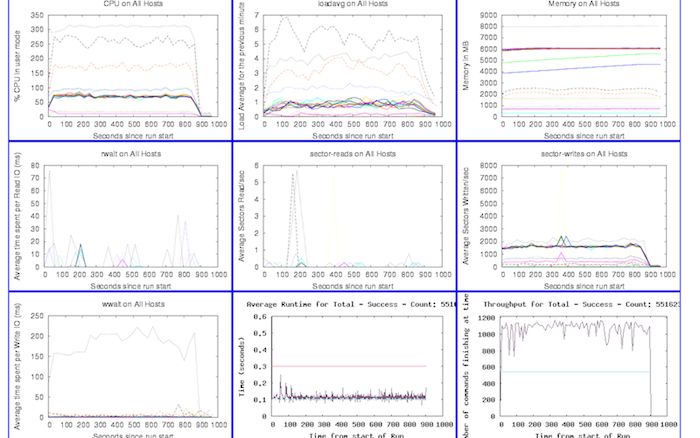
We gather a lot of metrics during a test, and for every major performance test we automatically generate a dashboard to help us drill into the results, a subset of which looks like this:

We gather this data from the system via SNMP, munin, per-component instrumentation, and other monitoring tools. We’ve been very happy with munin in particular as you can quickly add support for gathering new data types from remote hosts by writing simple Perl scripts.
Continuous Automated Testing
In any large system I’ve worked on the hardest problems are the integration problems, and a complex multi-component system such as a reservation system has these in spades. When we started doing performance testing, most of the system components weren’t finished and the interfaces between components kept changing. Furthermore, airline schedules, inventory and availability change rapidly over time.
There are countless factors that play into the performance and scalability of a complex system, and there are many philosophies around testing such systems, but in this post I want to discuss the technique that saves us the most time and money: continuous automated performance testing.
As discussed in the groundbreaking article Continuous Integration & Deployment In The Airline Industry [note: article not groundbreaking], ITA uses Hudson to build and test a complete reservation system on each check-in to the source tree (provided a build is not in progress). Hudson deploys the built software to a cluster of machines that are dedicated to continuous performance testing. After deployment, the load test master control software I discussed earlier runs a fixed scenario of load against the newly-deployed software. After a run completes, we store all of the results and instrumentation data in a database and update the graphs which trend test results over time. If our scripts find too much deviation in run time or throughput between this run and the previous runs, we set a status code so that Hudson can tell the people who’ve checked in since the last run that they may have broken the build.
Having a visual representation of performance issues in the continuous test environment has helped us tremendously because it both shortens the debug time and lets us see patterns of performance over time. Here’s an example of our throughput graph for a single component when someone breaks the build (click on the image for a larger version):

Along the X axis are revision numbers, and on our system the graph will show you the commit messages and the usernames of everyone who committed for each revision when you mouse over the data points. We also make the graph very user-friendly with a “green lines are good, red lines are bad” design. Clicking on a data point will bring you to our internal source code repository browser.
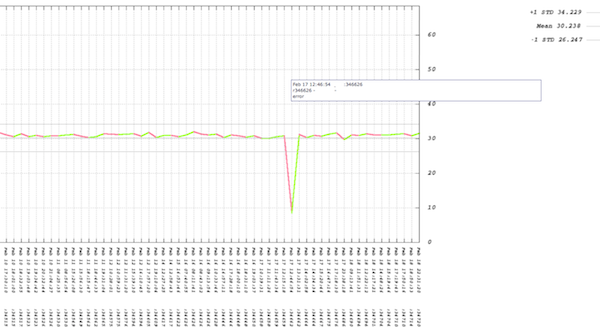
Throughput, which is shown in the above graph, is only one side of the story. What about the run time of the system during the issue with revision 346626?

The multiple trend lines in this graph represent the timings reported by each instrumentation layer in this component. In the case above the graph is saying that the issue is not with CPU time consumed by the component (that trend is flat), but is instead with time spent in the database. This helps us quickly narrow down where to start looking for the cause of the performance problem. In this example, the developer fixed the issue quickly because the developer had notification of the failed test within an hour of check-in and had all the tools and data needed to isolate and resolve the problem.
At ITA we have environments we use to run large-scale performance tests, but the setup, execution and analysis for such tests are very expensive in terms of computers (many hundreds) and people (tens for what may be a few weeks for a single test). Those resources aren’t cheap, and the wins from automating performance testing finding a single bug save us more then the cost of the computers and people we invested in building this system — and we routinely see 2-3 performance regressions in a month.
It doesn’t take many computing resources to build a system like the one I’ve described. Here are some tips for doing this yourself:
- Use real machines, as virtual machines suffer from the other guests on the same machine
- Define a fixed workload you can replay via your load generation tool as this lets you establish a baseline to trend and alert from
- Make sure your workload represents the majority of the types of load you’d see in production
- Start simple and add metrics and instrumentation as you need them, not before
- Don’t worry about fancy presentation of the results – it is more important that you start getting results
- Publicize your testing system widely once it is up and running to help spread a philosophy of continuous testing in your organization
If you’ve got any questions I’d be happy to answer them in the comments and would love to hear about any systems like this that other people have built.