Nerd Pub Trivia @ ITA

Every year ITA Software sends us all out on a boat to eat, drink and make merry, and this year I thought it would be fun to host a Nerd Pub Trivia. The idea came when, while playing regular pub trivia, the picture round category was “Famous Nerds”. My friends and I thought we were a lock for a perfect picture round score, but instead of pictures of Turing Award winners we got pictures of movie and TV nerds. We joked about how awesome it would be if there was real nerd pub trivia, so that’s what I made happen on ITA’s booze cruise.

The format was a shortened pub trivia, with songs played after reading each question:

  • 1 round of 4 questions with each question being worth either 1, 3, 5 or 7 points (you decide, you can only use each value once)
  • 1 special picture round (2 points for each item correctly identified)
  • 1 round of 4 questions with each question being worth 2, 4, 6 or 8 points (akin to the first round)
  • 2 final questions on which you wager up to 10 points each (win or lose what you wager)

Without further ado, here are the questions:

Famous Nerds: Who wrote in a famous RFC, “be conservative in what you do, be liberal in what you accept from others”?

Databases: What does ACID stand for?

Networking: How many bytes are there in an Ethernet address?

Systems Programming: What is the only UNIX syscall that returns twice?

Data Structures: This colorful binary tree is self-balancing and contains no data in the tree’s leaf nodes – what is it?

Operating Systems: Which process typically has the PID of 1 on a UNIX system?

Computing History: Which of these technologies was not invented at XEROX PARC: Ethernet, The Mouse, The Windowing GUI, laser printer?

SciFi/Fantasy: Who is the Kwistaz Haderach?

Video Games: What item must you retrieve from the Dungeons Of Doom in Nethack?

Role Playing Games: What does THAC0 stand for?

And of course, we had a picture round: ID The Programming Language & ID Carrier/GDS By IATA Code (hey, we’re an airline software company, I have to have some airline trivia).

I won’t post the answers here but feel free to post your answers in the comments (and be aware there’s a few correct answers to some of these questions).

Also, if you’re a nerd looking for a job at a cool place to work, check out ITA’s current job offerings. Not to spam my readers but it really is fun to work at a place where you can host a nerd pub trivia and 10 teams join the fun.

Thoughts On Measuring Managers

A few friends and I get together via Skype every other week or so to talk frankly about how we manage people. My friends on these calls are all in roughly the same position as I am – five to ten years of management experience in the software industry, with various amounts of direct and indirect reports. We’re all very technical people and have no problems managing lots of computers, but managing people is a very different problem. It’s rare that more than a week goes by that I don’t end up in a management situation that I’m not sure how to deal with, and having these calls allows me to discuss my doubts, shortcomings, and successes with an empathetic peer group. We’ve been calling these conference calls The Breakfast Club, after the original meaning of the term and the influential John Hughes movie (nobody has said anything, but I think I’m Brian).

Give me back my list of key performance indicators!

Last week I brought up the topic of measuring managers. I had just gone through review season at work and (as is typically for my group at work), we’d spent a lot of time revising our review process for individual contributors and for team leads. We spend a lot of time on reviews because reviews are important–reviews are when you not only tell someone how they are performing at work, but reward or punish them with raises, bonuses and promotions–and I think at work the group I’m in has come up with a system that sucks less than most systems I’ve been part of. The problem is that my group has now grown to the point where our system needs to measure and review people managers.

I brought up the topic of measuring managers during the last Breakfast Club call so I could hear other my friends’ thoughts on the matter. Below are some of the ideas from this phone call.

I need to define what skills makes a good manager.

At work, we track eleven different skills that we think are required for individual contributors and team leads, and we give each of these skills a weighting depending on the role. My friends had similar systems but with manager-specific skills and I think that’s what I need to do as well. Which skills are important for a manager is different for every company and for every level of management.

I haven’t defined the skills that are important for management at my work in my group yet (I’ve set aside time for this in the next few weeks), and I’m going to this with input from many of the people in my group. Any suggestions for skills that make up a good manager are appreciated.

Manager reviews, just like individual contributor reviews, need evidence.

I try to include evidence for my comments in any review, and I try to have that evidence show that some behavior was observed over time. For example, I’ll include ticket, bug, email or commit information as evidence, and I’ll include at least two data points, one from the first half of the review period and the other from the second half of the review period. You’d be surprised at how much you’ve forgotten someone has done (or not done). You’ll quickly realize that your intuition about how a review for someone should go is biased towards that person’s performance in the last month or so.

For managers, this evidence is harder to extract, as the artifacts of management are often decisions that aren’t in a formal tracking system. You’ll need to dig deeper, often in emails or meeting notes, to find the evidence that shows a manager making a decision, and you’ll need to keep on digging to find the reasons behind that decision and the outcome of that decision. Furthermore, by reviewing email threads and notes, you get an (incomplete) picture of the manager’s treatment of other people.

360 degree reviews are a good way to gather evidence, but be aware that the responses in a 360 have the same time bias I warned about before, and you should consider the motivations behind any response given in a 360.

I would go far as to say that a review that doesn’t have evidence for a majority of the comments is a poorly done review and the reviewer has failed to do his or her job.

Managers need to be evaluated in the context of their team, but that does not mean a manager’s review is based only the team’s deliverables.

Team-based deliverables should not be a manager’s only deliverables. I’ve worked in companies where everyone but the manager’s manager knows that the team is full of superstars doing great work in spite of their manager. The same team could be managed by my cat and that team would still do amazing work (there’s a point in here about knowing what kind of management is needed and when, but that’s for another day). On the other hand, a manager can make an entire team superstars by removing the barriers to the team’s effectiveness, or getting the team the resources it needs, or by clearly setting direction, or acting as a “shit umbrella” to help the team avoid distractions. On the third hand, a manager could do all those wonderful things for his team and still miss a team deliverable for a hundred other reasons.

I think the important thing about team-based deliverables is that you still need to balance the delivery of those objectives with the evaluation of the manager’s skills, and then you need to evaluate all of the evidence found during the review process.

Final Thoughts.

I’m going to spend some time reading up on manager evaluation on the Internet, and also reading many books with bad titles from the business section of the book store. What do you think about reviewing managers? How is it done where you work? If you’re an individual contributor, do you think your manager is being well-reviewed by his or her boss?

Recent Readings

Web

Devops Homebrew – Vladimir Vuksan is a regular at the Boston DevOps Meetups and I was happy to see this post on his previous job’s release process. The post is an excellent case study in DevOps in deployment.

An Agile Architectural Epic Kanban System – Part 1 – There’s a lot of room for Kanban and Agile in DevOps initiatives, and I think many people are already headed in that direction (I’ve started doing Kanban with the operations teams at ITA; they’ll be a post on how this is working in a few months). Having the developers and ops people use the same process management technique helps improve communication all around, and Kanban gives excellent visibility into what is happening now in an organization. The article above discusses using Kanban to give visibility into the process of architectural decision making, a process which is often invisible to developers or ops people.

Print

The Visible Ops Handbook – Tom Zauli from rPath brought me a copy of this at the last Boston DevOps Meetup, and I’m about halfway through. I think the practical steps recommended in Visible Ops would be very effective to gain control of an operations organization that is underwater, and after control is regained you can start automating as much as possible.

The Checklist Manifesto –  If you haven’t read Complications and Better you should stop reading this and pick up those two books right now. Dr. Gawande’s analytical look at process improvement in medicine (or lack thereof) is readable and it is easy to find parallels between his observations about medicine and any other industry. Both books are highly recommended for people who care about honest self reflection and evolutionary improvement.

The thesis of Dr. Gawande’s new book couldn’t simpler: checklists prevent errors. He backs this up with examples from many fields and the argument really is compelling; I can think of many cases at work where a checklist has saved the day. I think the DevOps trend of automating as much as possible, especially around deployment, is a way of encoding checklists. At ITA our deployment process went from a checklist that took a day or more to complete manually to code that performs the same checklist in under 45 minutes – that’s 45 minutes for an entire airline reservation system.

Recent Readings

The cloud is great. Stop the hype. – This is an excellent article on what cloud computing is and isn’t and when the use of the cloud is the correct technical or architectural choice. I had a long post planned on the overloaded term “cloud computing” but OmniTI covers all the important points in this article. Like any new approach to infrastructure deployment that promises quick provisioning of services, people often forget that all of that infrastructure needs to be managed. There are a lot of good tools coming out to help with that management but none make it zero cost.

Dissecting Today’s Internet Traffic Spikes – With the above article on cloud computing and this article on the sudden nature of internet traffic spikes, I’m becoming an OmniTI fanboy.  Part of my job is to worry about designing and provisioning correctly for sudden changes in traffic patterns, and Theo is correct that you have to design for spikes, not react to spikes.

Kanban For Sysadmins – I’ve started doing Kanban at work for one of our Operations teams and have been really pleased with the results so far — so much so that we’re rolling it out for another team this week and hopefully the rest of the department over the next few weeks. We track our work in Request Tracker, but it is hard to know 1. what is being worked on right now, and 2. how much throughput a team has. Kanban lets us know both, and it also lets us avoid the entire topic of prioritization of future work. We only prioritize when we are ready to start doing new work. I’ll post a follow-up to this once we’re further along in our Kanban experiment.

Hello From A libc-free World! – Have you ever wondered what, exactly, your “Hello, world!” program does? Jessica at Ksplice dives into what happens when you build a super-simple C program (it’s more complicated than you think!).

Data-Intensive Text Processing With MapReduce – A freely available draft in PDF of an upcoming book on using MapReduce to process large text datasets. One of the cool things we’ve done at ITA is add tracking data to each and every request that passes throughout our reservation system, and we output this tracking information in each log entry in every component we’ve written. The structure of this tracking data is such that if you aggregate the logs from all of the components you can easily construct a graph of the request’s path through the reservation system (including the asynchronous calls). The problem now is searching all of that log data, and I’ve been curious about MapReduce as it applies to this sort of data mining.

Performance Testing An Airline Reservation System

Until a few weeks ago I ran the performance and capacity testing team for the airline reservation system ITA develops. The group is under the umbrella of operations, which may seem out of place to many software shops, where typically the performance testing team exists in QA (or doesn’t exist at all until needed). We work very closely with development and QA as needed (and often, development has a dedicate set of engineers on performance work), and after doing performance work for the past few years, I’m convinced the best people for the job are the people that are skilled in development and systems administration (these are the DevOps people everyone is talking about). We’ve developed a lot of processes and tools to do our job and I think other people might find these ideas as useful as we have.

Testing Tools

At ITA we had to build many of the performance tools we use in-house because performance tools that could speak the airline industry protocols used by many interfaces to a reservations system (MATIP, for example) don’t exist. We also have a set of custom XML interfaces as well as a large collection of other interfaces that we need to send traffic to, or read instrumentation from. Our initial load generation script not only generated this traffic but also took care of all the other functions required to run an experiment, but this monolithic script didn’t scale. We ended up breaking up that script into agents that can be distributed across many machines, with each agent performing a single function needed for a load test. The agents are run by a master scheduling script which co-ordinates agent start and stop. In this way we can be sure that instrumentation requests aren’t blocking the load generation tools from working, and we can also schedule periodic events, report status, and do the hundred other things required for a full-system load test.

We gather a lot of metrics during a test, and for every major performance test we automatically generate a dashboard to help us drill into the results, a subset of which looks like this:


We gather this data from the system via SNMP, munin, per-component instrumentation, and other monitoring tools. We’ve been very happy with munin in particular as you can quickly add support for gathering new data types from remote hosts by writing simple Perl scripts.

Continuous Automated Testing

In any large system I’ve worked on the hardest problems are the integration problems, and a complex multi-component system such as a reservation system has these in spades. When we started doing performance testing, most of the system components weren’t finished and the interfaces between components kept changing. Furthermore, airline schedules, inventory and availability change rapidly over time.

There are countless factors that play into the performance and scalability of a complex system, and there are many philosophies around testing such systems, but in this post I want to discuss the technique that saves us the most time and money: continuous automated performance testing.

As discussed in the groundbreaking article Continuous Integration & Deployment In The Airline Industry [note: article not groundbreaking], ITA uses Hudson to build and test a complete reservation system on each check-in to the source tree (provided a build is not in progress). Hudson deploys the built software to a cluster of machines that are dedicated to continuous performance testing. After deployment, the load test master control software I discussed earlier runs a fixed scenario of load against the newly-deployed software. After a run completes, we store all of the results and instrumentation data in a database and update the graphs which trend test results over time. If our scripts find too much deviation in run time or throughput between this run and the previous runs, we set a status code so that Hudson can tell the people who’ve checked in since the last run that they may have broken the build.

Having a visual representation of performance issues in the continuous test environment has helped us tremendously because it both shortens the debug time and lets us see patterns of performance over time. Here’s an example of our throughput graph for a single component when someone breaks the build (click on the image for a larger version):

Along the X axis are revision numbers, and on our system the graph will show you the commit messages and the usernames of everyone who committed for each revision when you mouse over the data points.  We also make the graph very user-friendly with a “green lines are good, red lines are bad” design. Clicking on a data point will bring you to our internal source code repository browser.

Throughput, which is shown in the above graph, is only one side of the story. What about the run time of the system during the issue with revision 346626?

The multiple trend lines in this graph represent the timings reported by each instrumentation layer in this component. In the case above the graph is saying that the issue is not with CPU time consumed by the component (that trend is flat), but is instead with time spent in the database. This helps us quickly narrow down where to start looking for the cause of the performance problem. In this example, the developer fixed the issue quickly because the developer had notification of the failed test within an hour of check-in and had all the tools and data needed to isolate and resolve the problem.

At ITA we have environments we use to run large-scale performance tests, but the setup, execution and analysis for such tests are very expensive in terms of computers (many hundreds) and people (tens for what may be a few weeks for a single test). Those resources aren’t cheap, and the wins from automating performance testing finding a single bug save us more then the cost of the computers and people we invested in building this system — and we routinely see 2-3 performance regressions in a month.

It doesn’t take many computing resources to build a system like the one I’ve described. Here are some tips for doing this yourself:

  • Use real machines, as virtual machines suffer from the other guests on the same machine
  • Define a fixed workload you can replay via your load generation tool as this lets you establish a baseline to trend and alert from
  • Make sure your workload represents the majority of the types of load you’d see in production
  • Start simple and add metrics and instrumentation as you need them, not before
  • Don’t worry about fancy presentation of the results – it is more important that you start getting results
  • Publicize your testing system widely once it is up and running to help spread a philosophy of continuous testing in your organization

If you’ve got any questions I’d be happy to answer them in the comments and would love to hear about any systems like this that other people have built.

Continuous Integration & Deployment In The Airline Industry

Jim Bird had interesting things to say about continuous deployment in a recent blog post on his site, Building Real Software. Jim concluded a blog entry that is otherwise full of useful insights with these dismissive paragraphs:

It’s bad enough to build insecure software out of ignorance. But by following continuous deployment, you are consciously choosing to push out software before it is ready, before you have done even the minimum to make sure it is safe. You are putting business agility and cost savings ahead of protecting the integrity or privacy of customer data.

Continuous deployment sounds cool. In a world where safety and reliability and privacy and security aren’t important, it would be fun to try. But like a lot of other developers, I live in the real world. And I need to build real software.

I commented on Jim’s blog that I work on building airline reservation systems at ITA Software and we try to do as much continuous deployment and continuous integration as possible. We are absolutely far from perfect in what we do, but accepting that is the first step to accepting the evolutionary model of software operations.

I think the use of continuous integration/deployment (CI/CD) is orthogonal to issues around privacy, security and safety; if you don’t care about privacy, security and safety then you’re writing bad software, whether you choose to do CI/CD or not.

The reservation system ITA has built is a large, mission critical, multi-component, distributed, high-throughput transactional system. We run our software on Linux on commodity hardware, and the components are written in a variety of languages (Python, Java, C/C++, PL/SQL and LISP). Each component has to be highly available. The software needs to be secure; we process credits cards, flight information and sensitive passenger information. We don’t implement the systems that measure fuel or balance the plane, but as with any part of the airline industry, safety is very important.

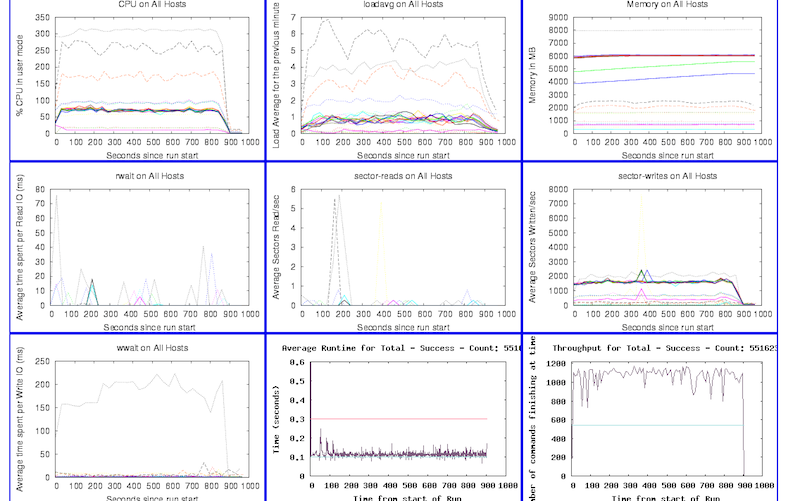
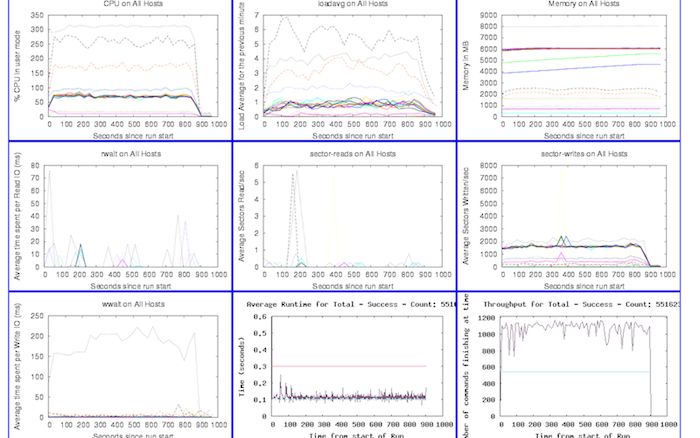
So how could we possibly continuously deploy or integrate this software? We deploy an entire reservation system to our development environment at least three times a week. We run an automated set of integration tests against this complex system to verify a deployment. We build and package each component of the software automatically on every check-in to our source tree and automatically run a set of tests against this software. We build controls around privacy, security and safety throughout this system.

We trigger our build/package/deploy cycle using Hudson and custom scripts. The build process is unique per component but generally follows industry standard practices per language or technology, and the packaging is done with RPM. The interesting part, and the part that makes CI and CD work for us, is that we’ve built software and processes to represent the reservation system as a whole. We package manifests that represent, in Python’s Coil, the dependency matrix of the components and services that make up a working reservation system. The coil in the manifest file details all of the software RPMs, component configurations, service validation scripts to be run, monitoring configurations and more. Manifests themselves are revision controlled, and each manifest has an ID that is all that is needed to start a deployment. If we chose to, we could have a manifest built and deployed on every check in to our source tree (this isn’t feasible due to human and computer resource limitations, but is technically possible). Manifests can be promoted throughout the other environments as needed, so we can move from the automatically deployed and tested environments to customer facing or testing environments that may need to be static for long periods of time.

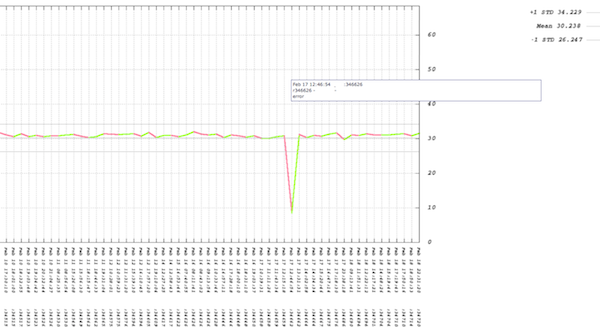
Our deployment framework can automatically control the state of our monitoring. The framework will suppress monitoring during deploys, check monitor states any time during a deployment, and enable monitoring at the end of the deployment. The framework also ties in to our ticketing system by automatically opening a ticket for every deploy and documenting deploy state in the ticket. If a deployment fails, we can track the resolution directly in the ticket that the tools opened for the deploy. The deployment framework automatically resolves the ticket it opened after a successful deploy.

We also use service command and control software that we’ve built in house (similar to ControlTier) to make sure the services are in the correct state. We wrote our own service management framework because at the time we started this project there wasn’t existing software that met our particular needs; now there are many excellent solutions.  Our deployment framework, which is driven by the manifest described above, has the ability to work with our service management framework so we can verify the state of our components as part of our deployment.

One of the differences between our CI/CD process and the process at Flickr or Facebook is that our customers, both internal and external, want predictable change and often dictate our release cycles. Perhaps this is what Jim means by CI/CD putting customers at risk, because some customers don’t want continuous updates to their software. Despite this, we still do CI/CD internally at ITA because failing a customer deploy can mean an airplane doesn’t fly. I’m not interested in learning how to deploy a reservation system the day of a production deployment with those kinds of stakes.

The big advantage of automating our deployments as much as possible and doing as many deploys as possible is the same in the airline industry as it is at any company: we deploy a lot so we know our deploys work. Continuous deployment is nothing more than another step in assuring that you are minimizing errors throughout your service. Not doing CI/CD is like not doing QA.

I’ve got more stories about the successes (and many, many struggles) of CI/CD at ITA and they’ve been kind enough to give me permission to post some of the stories here (we do some really cool things in performance testing that I’m excited to write about), so please check back often for more post about CI/CD at ITA.